

Every web page you’ve ever loaded was powered by a real power station, somewhere. That’s not a metaphor. Somewhere out there, a turbine turned or gas burned so that a page could appear on your screen.
We’ve been working on sustainable web design for a few years now, helping clients, and B Corp businesses in particular, understand and reduce their digital carbon footprint. And in all that time, one thing has been consistently hard: making it feel real. Tell someone their web page produces half a gram of CO₂ per view and you can watch the number bounce off. Half a gram? That’s nothing.
Which is true. It is nothing. And that’s exactly the problem, and exactly the point.
The lightbulb argument
The comparison I always reach for is the LED lightbulb. Swap one bulb in your hallway and the grid never notices. Swap every bulb in the country and it adds up to a significant change. No single bulb mattered; all of them together did.
Web pages work on precisely the same maths. One page view is grams. But a modest site doing 10,000 views a month is around 60 kg of CO₂ a year, roughly a 220-mile drive in a petrol car. A site doing a million views a month is into tonnes. Multiply that by over a billion websites and the web’s “little pages” add up to an estimated 2-4% of global emissions. That’s the same league as aviation.
Every little helps, because there is an enormous amount of little.
So we built the story
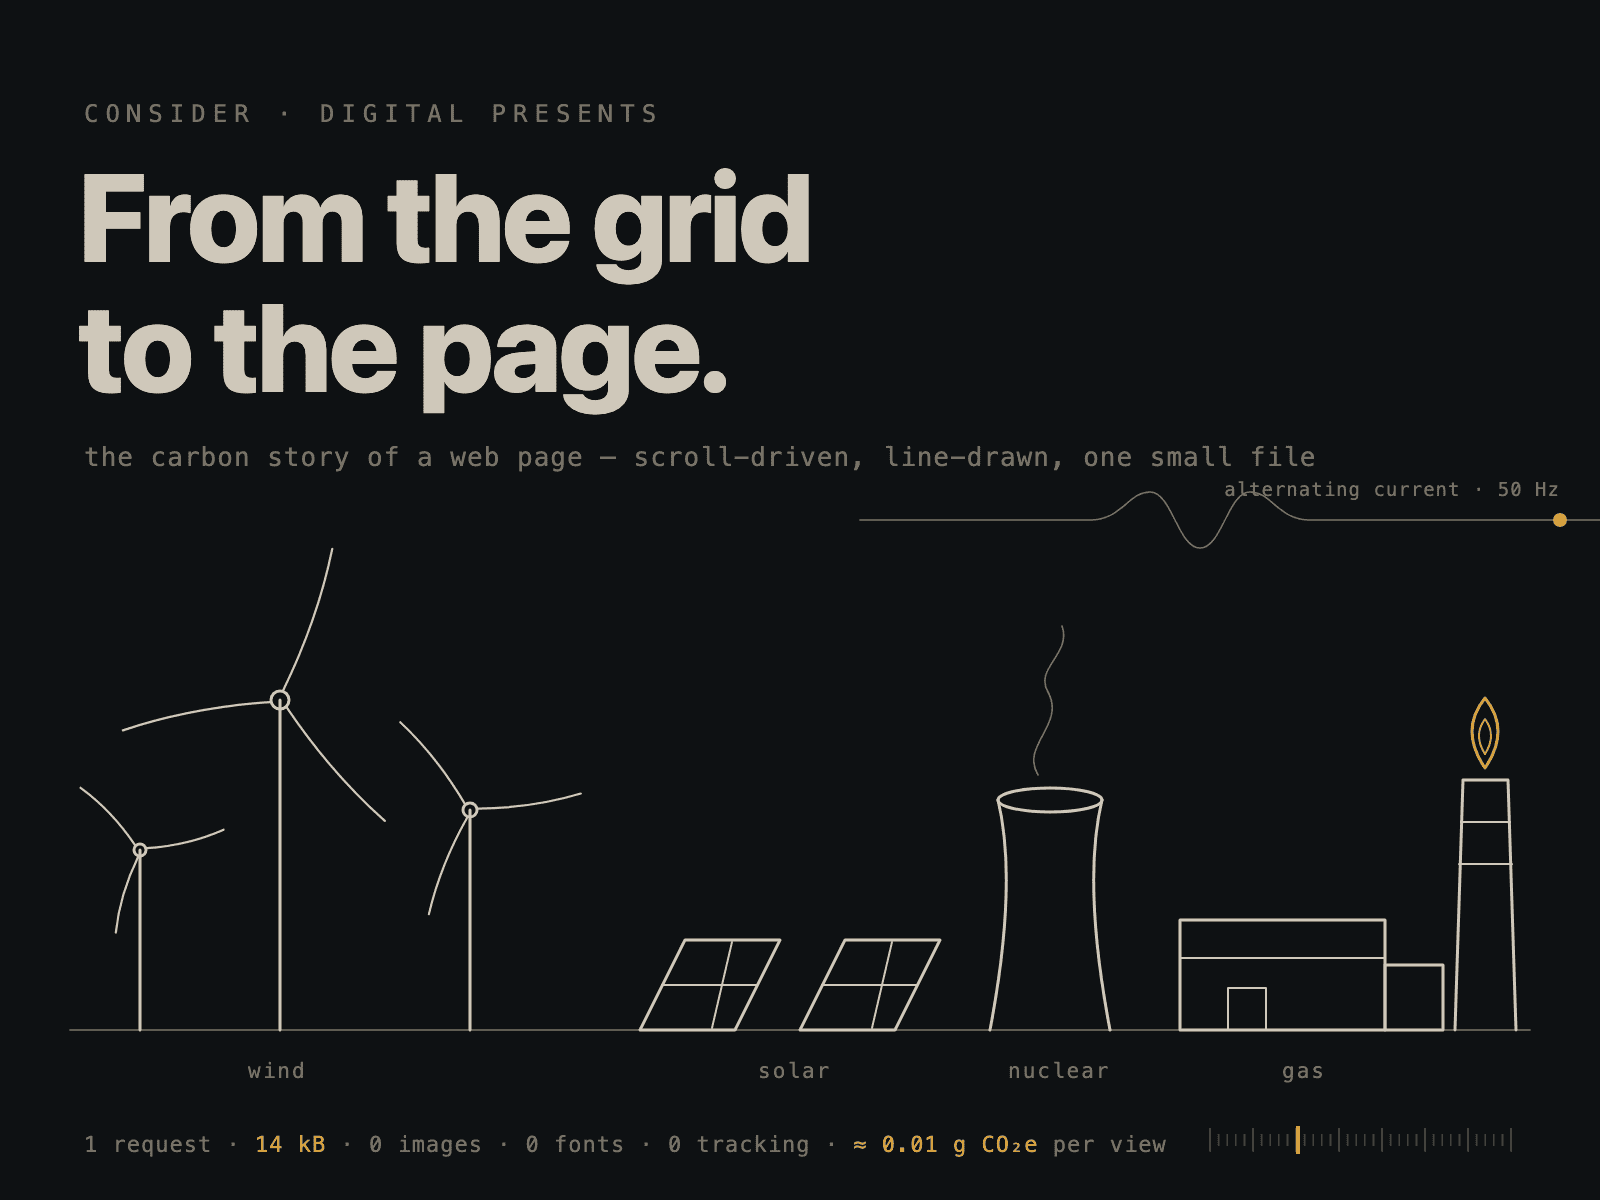
Rather than write another explainer, we decided to show it. From the Grid to the Page is a scroll-driven mini-site that follows the electricity behind a single page load, end to end:
- Generation: the 2024 GB energy mix (a milestone year: wind generated more electricity than gas for the first time), and the ~125 g of CO₂ each kilowatt-hour still carries
- Transmission: 400,000 volts stepped down to the socket, losing around 8% as heat along the way
- The request: the journey from your thumb to a data centre and back, and why the distance data travels matters
- The page itself: the median 2.7 MB web page pulled apart layer by layer: images, JavaScript, fonts, video
- The multiplication: where half a gram becomes tonnes
- And the fixes: because most pages could lose half their weight and nobody would notice
The whole thing is drawn in animated line-work; wind turbines that turn as you scroll, a pulse of current travelling down pylon lines, a web page exploding into its parts.
Practising what it preaches
Here’s the bit I’m proudest of. A site about web carbon has no business being heavy, so we set ourselves a rule from the first sketch: it had to be evidence for its own argument.
The entire site, every animation, every illustration, every word, is one file, one request, around 14 kB over the wire. There are no images (everything is drawn in code), no web fonts (the type on every device is already beautiful), no tracking scripts, no animation libraries. Even the dark colour palette is doing quiet work: dark pixels draw less power on the OLED screens most phones now use.
For context, the median web page is about 2.7 MB. This one is around 98% lighter, at roughly 0.01 g of CO₂ per view. There’s a receipt at the bottom of the page that itemises all of this, because we think claims like these should come itemised.
None of that required exotic engineering. It required deciding, at the start, that weight was a design constraint, the same way a brief might fix a brand colour or a deadline. That decision is available on every project. It’s just rarely taken.
The quiet villain: site bloat
The uncomfortable truth in our audit work is that most websites don’t launch heavy; they become heavy. A team uploads images straight off a phone. A plugin adds a script. A video goes on the homepage “just for the campaign” and never leaves. Nobody decided to triple the page weight; it happened one reasonable choice at a time. Since 2012, the median page has roughly tripled in size, and it’s rarely three times more useful.
That’s why we run ongoing CO₂ audits rather than one-off health checks: catching the creep is worth more than a certificate.
Where does your website stand?
Take five minutes with the story, it’s a nicer way to spend a scroll than most things on the internet, and it costs about a hundredth of a gram.
Then, if you’re curious about your own site, run it through our carbon checker. It’s free, it takes seconds, and the number that comes back is the start of a genuinely useful conversation, one lightbulb at a time.
