We measured the carbon intensity of every Premier League team’s website to find out who’s leading the pack off the field in digital sustainability.
Why test website carbon emissions?
Because internet traffic uses electricity, lots of it. The internet’s carbon emissions were on par with the emissions from the aviation industry back in 2019. Growth in aviation follows a gentle upward curve still but nothing like the speed of growth in digital data. Which currently doubles every 2 years.
Because of the sheer scale, even small improvements in website efficiency can play an important role in reducing our energy usage.
About our test.
- We tested 5 different urls for each club. Where possible we tested similar pages across all the sites. For example the homepages and shop pages.
- Our test results use UK-specific figures for the CO2 intensity of Electricity generation, however, it should be noted that Premier League football clubs undoubtedly have a global audience.
- For a fair comparison, we’ve estimated traffic to all sites at a conservative 2 million page views per month. SEO tools estimated search traffic of 1.5 million pages per month for several premier league clubs and so we estimated additional non-search origin traffic of an extra 500k. In reality, this number could be far higher. But this serves to give a standardised dataset.
- The sites were all tested in February 2024.
Which premier league club websites used the least CO2.
Top performers
1. Burnley
2. Chelsea
3. Arsenal
4. Brighton & Hove Albion
5. Manchester City
Which premier league club websites used the most CO2
Worst performers
1. Wolverhampton Wanderers2. Brentford
3. Aston Villa
4. Leeds United
5. Watford
How do their website carbon footprints compare to clubs overall carbon footprints?
According to the excellent insight from Certified Carbon, the top five premier league clubs who achieved the Certified Carbon Gold Standard were.
1. Manchester City
2. Arsenal
3. Tottenham Hotspur
4. Liverpool
5. Wolverhampton Wanders
The gap between the best and worst-performing websites is over 54 tonnes of CO2 annually. That is Burnley the best performing with an average CO2 impact of 0.398 per page view and Wolves with 2.658.
Premier League Table of Website CO2 Impact
| Organisation | Average CO2 of tested pages | Yearly in tonnes of CO2 based on 2 million visits per month |
|---|---|---|
| Burnley – https://www.burnleyfootballclub.com/ | 0.398 | 9.552 |
| Chelsea – https://www.chelseafc.com/ | 0.568 | 13.632 |
| Arsenal – https://www.arsenal.com/ | 0.644 | 15.456 |
| Brighton & Hove Albion – https://www.brightonandhovealbion.com/ | 0.75 | 18 |
| Manchester City – https://www.mancity.com/ | 0.816 | 19.584 |
| Manchester United – https://www.manutd.com/ | 0.82 | 19.68 |
| West Ham United – https://www.whufc.com/ | 0.916 | 21.984 |
| Crystal Palace – https://www.cpfc.co.uk/ | 1.064 | 25.536 |
| Everton – https://www.evertonfc.com/ | 1.186 | 28.464 |
| Newcastle United – https://www.nufc.co.uk/ | 1.556 | 37.344 |
| Liverpool – https://www.liverpoolfc.com/ | 1.654 | 39.696 |
| Tottenham Hotspur – https://www.tottenhamhotspur.com/ | 1.76 | 42.24 |
| Aston Villa – https://www.avfc.co.uk/ | 2.302 | 55.248 |
| Brentford – https://www.brentfordfc.com/ | 2.496 | 59.904 |
| Wolverhampton Wanderers – https://www.wolves.co.uk/ | 2.658 | 63.792 |
| Luton Town – https://www.lutontown.co.uk/ | 1.706 | 40.944 |
| Fulham – https://www.fulhamfc.com/ | 1.826 | 43.824 |
| AFC Bournemouth – https://www.afcb.co.uk/ | 1.124 | 26.976 |
| Nottingham Forest – https://www.nottinghamforest.co.uk/ | 1.602 | 38.448 |
| Sheffield United – https://www.sufc.co.uk/ | 3.122 | 74.928 |
What are the best-performing websites doing well?
We took a deeper look at Burnley FC’s website, one major contributing factor toward their low carbon consumption figure is the well-optimised image file sizes. We also noted that every image we checked used next next-generation image format WebP. Which follows Google’s own advice for image compression and site speed.
While detailed testing of the Burnley website suggested there are some further potential optimisations around caching in particular the gains appear to be very marginal.
How could the most polluting websites improve?
This isn’t an in depth audit into the Wolves website, but our initial analysis showed that considerable improvements could be made to the tested Home page and Shop pages with a few straightforward updates to the media.
Over 2000kb of data could be saved for each load of the Wolves homepage if all images were compressed and converted to a next-generation format.
Premier league football club homepages and shop pages as tested are image dense. In the case of the Wolves site testing reveals a number of optimisations around images.
Significant improvements in the carbon efficiency of the site could be made through.
– Optimisation of image compression
– Images converted/replaced with Next Gen format equivalents
– Images being sized appropriately for the rendered size.
As an example we took one image from the tested Wolves homepage, it’s original transfer size as a file was 733 kb
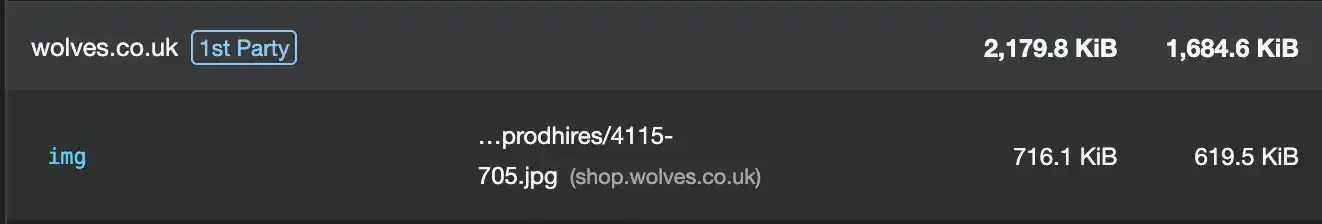
With a first pass compression we were able to reduce that to 114kb. An 84% decrease without any noticeable change in image quality. Further optimisation to a next generation image format, in this case WebP resulted in a reduction in size to 60KB. Almost a 92% reduction.
Applied to all images we estimate savings far greater than the 2227KIB estimated by Google would be possible.
Estimating traffic
To arrive at a fair comparison point for website traffic we used figures from Ahrefs for several clubs across the league. That gave us an estimate of the traffic volume in particular from search. To further validate we tested the Manchester City website on Similar web which estimates it’s monthly traffic at 3.1 million visits and 4.23 page views per visit.
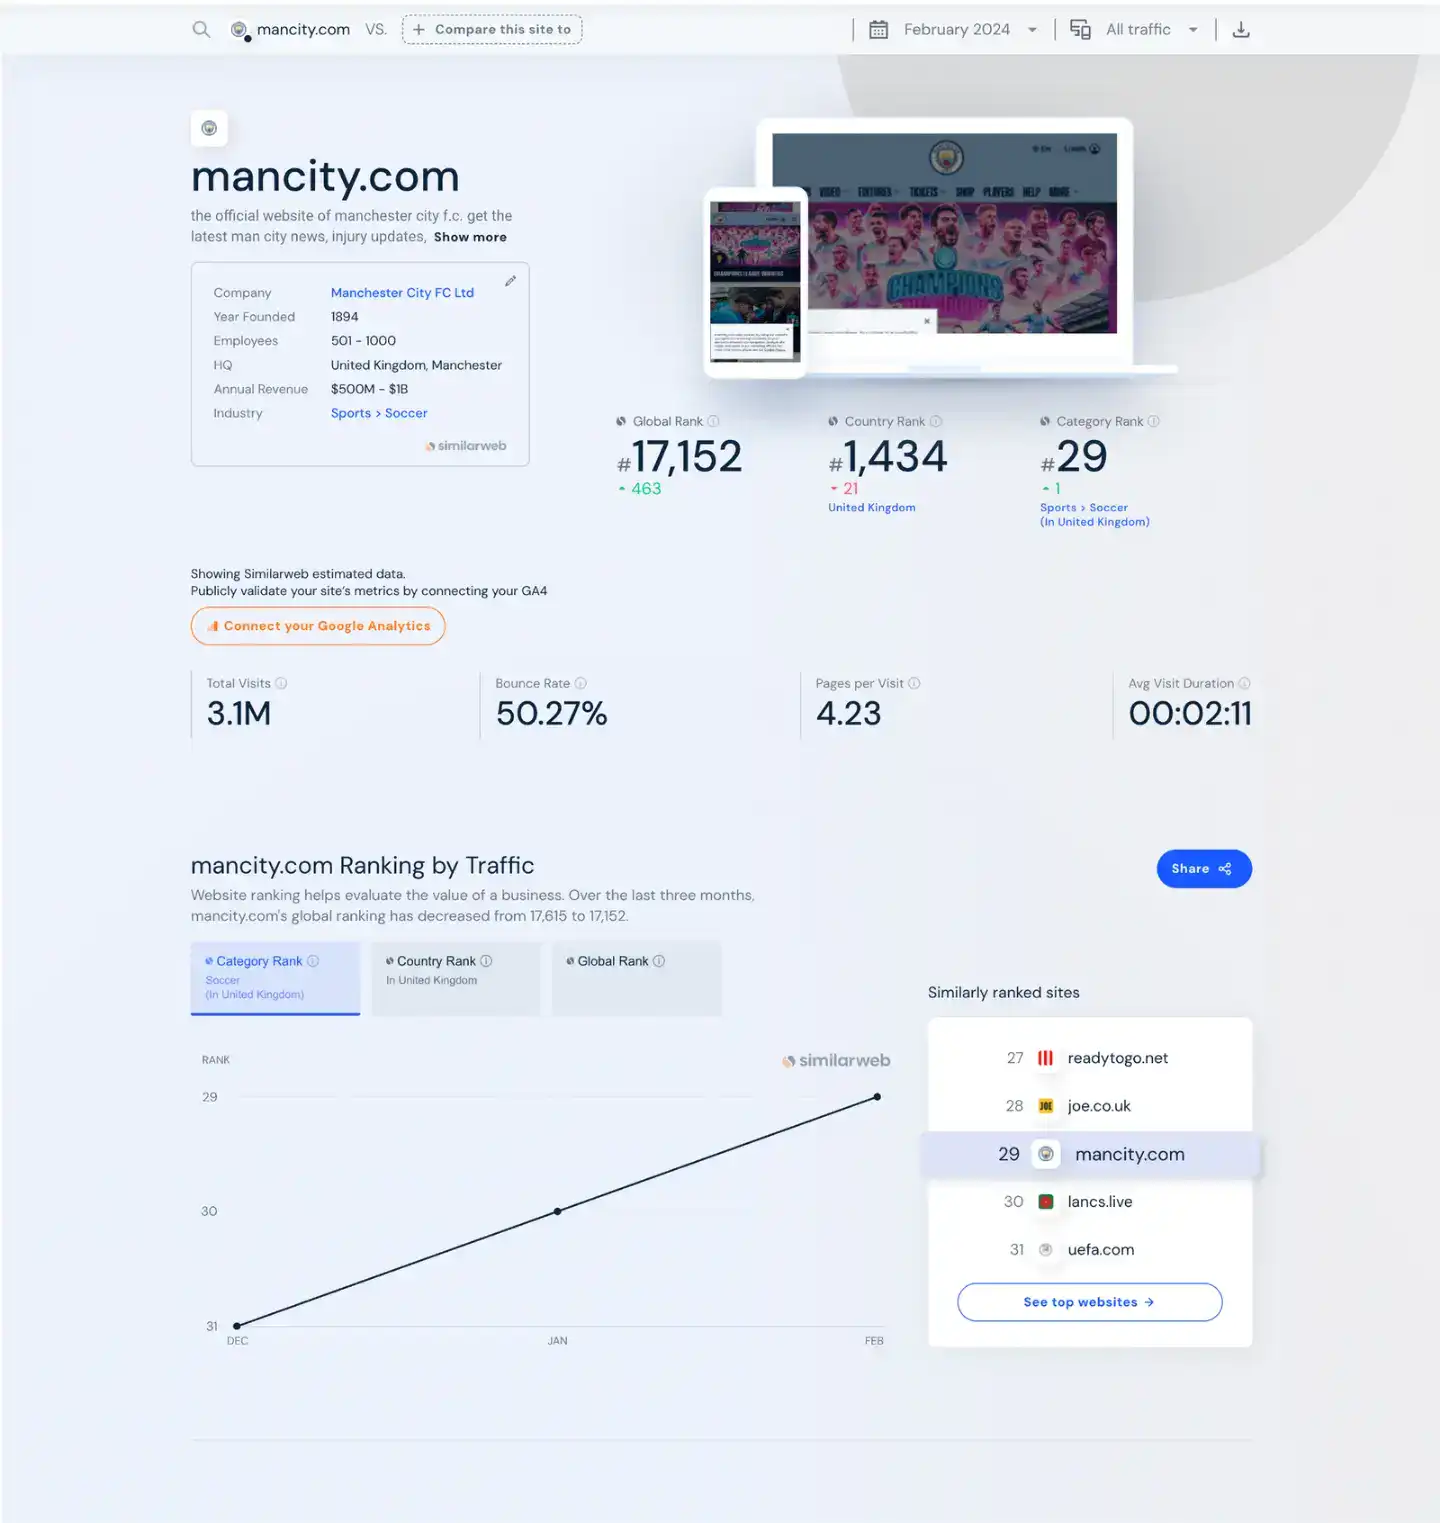
Based on that traffic estimate our comparison figure is very conservative. Manchester City’s actual CO2 output from their website would likely look more like this.
Average CO2g of tested web pages: 0.816.
Monthly visits: 3.1million x 4.23 pages per visit x 12 months = 128.4 tonnes of CO2
An estimate of traffic volume to Manchester United’s website from September 2020 was a huge 10.2 million visits and 2.17 page views per visit.
How can premier league clubs improve their digital carbon footprint?
To borrow the quote “only what gets measured, gets managed” from Peter Drucker a logical first step for football clubs looking to improve their digital carbon footprint would be to commission regular measurement of their websites CO2.
Regular monitoring helps to give more accurate data because it can use real traffic data in conjunction with the latest CO2 energy intensity for electricity generation figures.
At Consider we combine carbon measurement with website sustainability audits. These audits are designed to discover and highlight website changes and optimisations that improve energy efficiency and reduce CO2 usage.
Get in touch and make sure your website has a positive impact on climate change.