August 21, 2025
The Premier League is not just a global sporting powerhouse; it’s also a digital giant. Millions of fans visit club websites every week to buy tickets, shop for merchandise, and follow the latest news. But those clicks come at a cost: energy consumption and CO₂ emissions. Last year we tested the website of every premier league club and published our league table. This year we’re revisiting. This report examines how each club’s website performs in terms of carbon efficiency, highlighting the best-performing sites. We’ve compared these to our research data from last year (2024) and key sustainability insights from the clubs for 2025.
Methodology
To ensure fair comparison, we tested four core pages per Premier League club:
- Homepage
- Shop
- Teams
- Fixtures
All measurements were taken in August 2025, using our carbon assessment tool. CO₂ calculations were based on UK electricity grid intensity and calculated to annual figures with estimated traffic of 2 million website visitors per month.

The Results
Premier League Website CO₂ Emission Rankings 2025
| Rank | Club | Avg CO₂ / Page (2025) | Yearly CO₂ (kg) | Yearly CO₂ (t) | Change vs 2024 (t) |
| 1 | Arsenal | 0.710 kg | 17,040 kg | 17.04 t | +1.58 t |
| 2 | Manchester City | 1.070 kg | 25,680 kg | 25.68 t | +6.10 t |
| 3 | Chelsea | 1.168 kg | 28,020 kg | 28.02 t | +14.38 t |
| 4 | Everton | 1.200 kg | 28,800 kg | 28.80 t | +4.34 t |
| 5 | Manchester United | 1.258 kg | 30,180 kg | 30.18 t | +10.50 t |
| 6 | Bournemouth | 1.325 kg | 31,800 kg | 31.80 t | +4.82 t |
| 7 | Crystal Palace | 1.400 kg | 33,600 kg | 33.60 t | +8.06 t |
| 8 | Liverpool | 1.748 kg | 41,940 kg | 41.94 t | +2.24 t |
| 9 | Brighton | 1.863 kg | 44,700 kg | 44.70 t | +26.70 t |
| 10 | Nottingham Forest | 2.013 kg | 48,300 kg | 48.30 t | +9.86 t |
| 11 | Wolves | 2.033 kg | 48,780 kg | 48.78 t | –14.98 t |
| 12 | West Ham | 2.143 kg | 51,420 kg | 51.42 t | +29.44 t |
| 13 | Fulham | 2.215 kg | 53,160 kg | 53.16 t | +9.34 t |
| 14 | Burnley | 2.258 kg | 54,180 kg | 54.18 t | +35.08 t |
| 15 | Newcastle United | 2.743 kg | 65,820 kg | 65.82 t | +28.56 t |
| 16 | Aston Villa | 3.325 kg | 79,800 kg | 79.80 t | +24.56 t |
| 17 | Tottenham Hotspur | 3.390 kg | 81,360 kg | 81.36 t | +39.12 t |
| 18 | Brentford | 3.988 kg | 95,700 kg | 95.70 t | +35.80 t |
Note that Sheffield United, Luton Town, Sunderland, and Leeds United aren’t included in this table, as they have not been Premier League clubs over both research periods
Winners & Losers
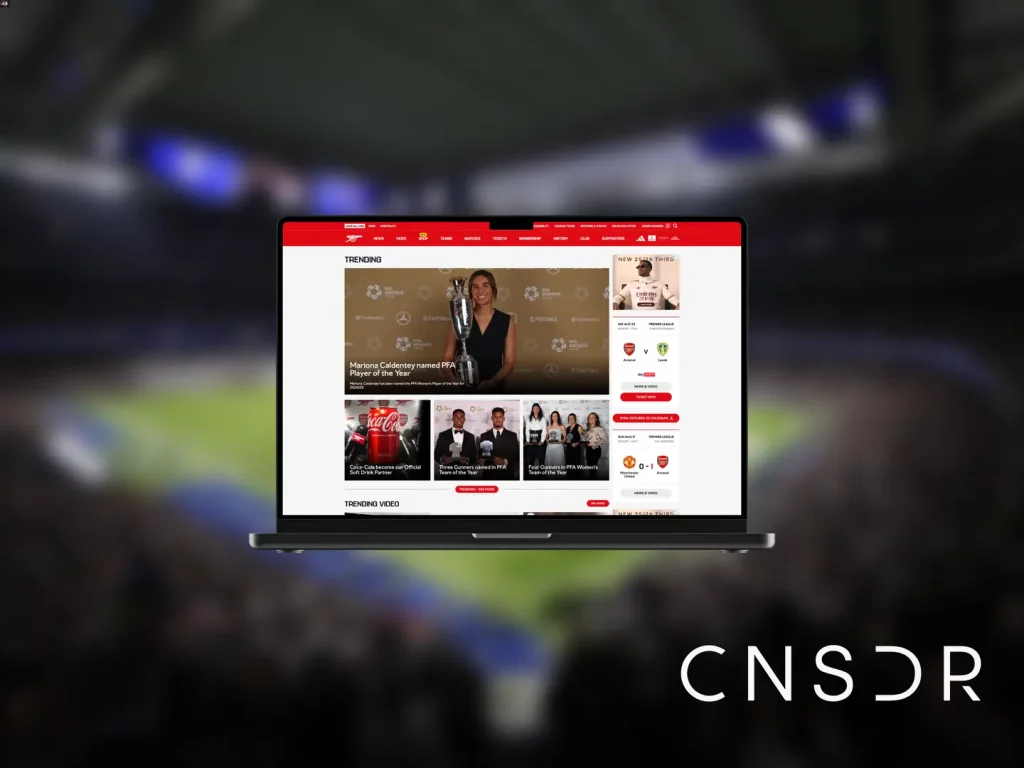
- Biggest winner: Arsenal win the crown off of Burnley with the cleanest digital footprint, producing just 17 tonnes of CO₂ per year.
- Biggest improver: Wolves cut almost 15 tonnes compared to 2024, making them the only club to reduce their footprint.
- Biggest loser: Tottenham Hotspur and Brentford both sit at the bottom, each producing over 80 tonnes annually.
- Fastest riser in emissions: (again) Tottenham Hotspur added 35 tonnes compared to last year, the sharpest increase in the league.
Why This Matters
To put these numbers in perspective:
- 1 tonne CO₂ = ~2,500 miles in a petrol car.
- Arsenal’s 17 t = heating two UK homes for a year.
- Wolves’ 49 t = powering five UK homes.
- Brentford’s 96 t = driving 240,000 miles (9.6 times around the equator) or heating 12 UK homes.
Digital sustainability may seem small, but at Premier League scale — millions of visitors each month — website optimisation can deliver major carbon savings.
Sustainability Beyond the Web

Premier league clubs appear to be taking sustainability seriously. We checked their sustainability policies and ranked them into tiers. Disappointingly however we didn’t find any mention of digital sustainability.
Premier League Sustainability Rankings 2025
| Rank | Club | Tier | Key Features of Sustainability Model |
| 1 | Tottenham Hotspur | Tier 1 | Race to Zero, net zero 2040, 100% renewable stadium, biodiversity projects, education outreach. |
| 2 | Arsenal | Tier 1 | Science Based Targets approved, net zero 2040, renewable energy, Arsenal Forest project, annual reporting. |
| 3 | Liverpool | Tier 1 | “The Red Way”, ISO 20121 certified, renewables, plastics reduction, food redistribution, public reports. |
| 4 | Manchester United | Tier 1 | UN Sports for Climate Action, net zero 2050, 92% recycling, renewable energy, long-term framework. |
| 5 | Manchester City | Tier 1 | “Game Plan for a Better World”, global CFG rollout, Etihad powered by renewables, biodiversity programmes. |
| 6 | Everton | Tier 2 | Net zero 2040 target, green design in new Hill Dickinson stadium build. |
| 7 | Sunderland | Tier 2 | “Ready Eco” strategy, net zero 2040, energy self-sufficiency target for 2028. |
| 8 | Chelsea | Tier 2 | Strong environmental policy, renewable energy, carbon reduction commitments. |
| 9 | Wolves | Tier 2 | Dedicated sustainability hub, detailed on waste, energy, and travel. |
| 10 | West Ham United | Tier 2 | Sustainability strategy, carbon reduction, recycling, plastic reduction on matchdays. |
| 11 | Brighton & Hove Albion | Tier 3 | “MyAlbion, MyPlanet” strategy, community education, biodiversity, circular fashion partnerships. |
| 12 | Newcastle United | Tier 3 | Sustainability hub, energy efficiency, recycling initiatives. |
| 13 | Nottingham Forest | Tier 3 | Environmental section, plastics reduction, community eco-education. |
| 14 | Fulham | Tier 3 | Five pillars: clean energy, travel, waste, plastics, biodiversity. |
| 15 | Leeds United | Tier 3 | Environmental policy, low-carbon design in stadium redevelopment. |
| 16 | Crystal Palace | Tier 3 | “Palace for the Planet” campaign, plastics reduction, education programmes. |
| 17 | Burnley | Tier 4 | Environmental policy, procurement and waste focus. |
| 18 | Bournemouth | Tier 4 | General sustainability policy, plastics reduction campaigns. |
| 19 | Brentford | Tier 4 | Campaign-driven (e.g. Green Football Weekend), no detailed roadmap. |
| 20 | Aston Villa | Tier 4 | Community-focused sustainability via Foundation, no net zero or detailed framework. |
While website emissions are important, they form just one part of clubs’ environmental strategies. Clubs fall into four broad tiers:
Tier 1 – Fully Developed Frameworks
(Tottenham, Arsenal, Liverpool, Manchester United, Manchester City)
These clubs lead the way with comprehensive, independently verified sustainability strategies. Their commitments include net zero targets (2040–2050), alignment with international frameworks like Race to Zero and UN Sports for Climate Action, and transparent annual reporting. They invest in renewable energy, biodiversity programmes, waste reduction, and community education. Importantly, their frameworks are long-term, data-driven, and publicly accountable.
Tier 2 – Structured Policies with Clear Goals
(Everton, Sunderland, Chelsea, Wolves, West Ham United)
These clubs have established policies and clear sustainability goals, often tied to specific deadlines (e.g. net zero by 2040). Many integrate sustainability into infrastructure projects, such as Everton’s new Hill Dickinson stadium. While they show strong intent with renewable energy and waste strategies, their frameworks are less comprehensive than Tier 1, with fewer global certifications or independent audits. They are progressing but still lack the depth and external validation of the leaders.
Tier 3 – Active but Developing
(Brighton, Newcastle United, Nottingham Forest, Fulham, Leeds United, Crystal Palace)
Clubs in this tier are taking active steps but remain in the developmental stage of their sustainability journeys. Their initiatives include themed campaigns, community outreach, plastics reduction drives, and local biodiversity projects. However, reporting is inconsistent, targets are sometimes vague, and strategies are more short-term than structural. These clubs are visible in their communities but need to strengthen governance, set measurable goals, and adopt international frameworks to climb higher.
Tier 4 – Early-Stage / Policy Only
(Burnley, Bournemouth, Brentford, Aston Villa)
This group sits at the earliest stage of sustainability development. Most have issued broad policy statements or run high-profile campaigns, but lack a detailed roadmap, net zero target, or formal governance structure. Their efforts are often reactive and PR-led, focusing on issues like plastics reduction or matchday campaigns without embedding sustainability into core operations. For these clubs, the challenge is to transition from awareness-raising to robust, measurable, and accountable strategies that match the scale of the climate challenge.
Key Contrasts
- Tottenham Hotspur – Strategy vs. Digital Reality
Tottenham stand out for having one of the strongest sustainability frameworks in the league—they are part of the Race to Zero, have committed to net zero by 2040, run biodiversity projects, and embed sustainability into community education. Yet, their website emissions are among the very worst, ranking 17th out of 18 in digital performance. This sharp contrast highlights a gap between corporate sustainability ambitions and the technical execution of their digital platforms. - Arsenal – Consistency Across the Board
Arsenal represent the gold standard: top-ranked in website CO₂ efficiency while also holding one of the most rigorous sustainability frameworks. Their Science Based Targets are approved, they have transparent reporting, and their “Arsenal Forest” project demonstrates innovation. Arsenal prove that operational excellence and digital performance can align, setting a benchmark for others. - Wolves – Digital Progress Despite Mid-Tier Strategy
Wolves don’t yet operate at the scale of Tier 1 clubs in terms of sustainability governance, but their website showed the biggest year-on-year improvement, cutting almost 15 tonnes of CO₂. This shows that even clubs without the deepest frameworks can still achieve measurable progress through targeted action—particularly in digital operations. - Brentford & Aston Villa – Double Weakness
Both Brentford and Aston Villa fall into the lowest sustainability tier and also sit at the bottom of the digital rankings. Their frameworks are largely policy-light or PR-driven, lacking clear targets or measurable outcomes. At the same time, their websites rank among the highest emitters. This dual weakness suggests a lack of integration of sustainability into both digital strategy and broader club operations, leaving them trailing the rest of the league.
Conclusion
The 2025 rankings reveal a clear message: clubs cannot afford to ignore digital emissions. With websites acting as the gateway for millions of fans, efficiency must be seen as part of the broader sustainability agenda. Arsenal show what’s possible, while Tottenham and Brentford highlight the risks of neglecting digital carbon footprints. For the Premier League, there are easy gains to be made towards their net zero goals with some basic website optimisations and moves towards sustainable web policies.
Without regular measurement websites often become bloated and less efficient, something that’s reflected in the comparison between our measurements last year of premier league club websites and this years data. A simple step for all organisations that want to improve or maintain website efficiency and reduce energy consumption creep is with a website sustainability audit plan.

Ready for a conversation?
Get in touch